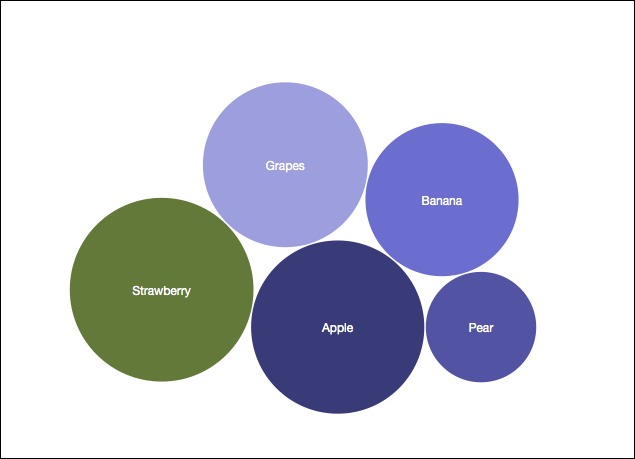
How to make a basic Force Chart in D3
Getting your data into CSV format
Use a spreadsheet program to export your data as a CSV

At the top of the
NOTE: Example below uses D3js Version 5.
Full example below
This project requires fruit.csv file to be in the same folder, and the project has to be run from a webserver.
<!DOCTYPE html>
<html>
<head>
    <meta charset="utf-8">
    <title>Basic Bubble Chart</title>
    <meta http-equiv="X-UA-Compatible" content="IE=edge,chrome=1">
    <meta name="viewport" content="width=device-width, initial-scale=1">
    <style>
    /* custom css styles will go here */

    </style>
</head>
<body>

<script src="https://d3js.org/d3.v5.min.js"></script>
<script>
var diameter = 500, //max size of the bubbles
    format   = d3.format(",d"),
    color    = d3.scaleOrdinal(d3.schemeCategory10);
    //more color options: https://github.com/d3/d3-scale-chromatic

var bubble = d3.pack()
    .size([diameter, diameter])
    .padding(1.5);

var svg = d3.select("body")
    .append("svg")
    .attr("width", diameter)
    .attr("height", diameter)
    .attr("class", "bubble");

d3.csv("fruit.csv").then(function(data){


    //convert numerical values from strings to numbers
    data = data.map(function(d){ d.value = +d["Amount"]; return d; });

    //Sets up a hierarchy of data object
    var root = d3.hierarchy({children:data})
      .sum(function(d) { return d.value; })
      .sort(function(a, b) { return b.value - a.value; });

    //Once we have hierarchal data, run bubble generator
    bubble(root);

    //setup the chart
    var bubbles = svg.selectAll(".bubble")
        .data(root.children)
        .enter();

    //create the bubbles
    bubbles.append("circle")
        .attr("class", "circle")
        .attr("r", function(d){ return d.r; })
        .attr("cx", function(d){ return d.x; })
        .attr("cy", function(d){ return d.y; })
        .style("fill", function(d) { return color(d.value); });

    //format the text for each bubble
    bubbles.append("text")
        .attr("x", function(d){ return d.x; })
        .attr("y", function(d){ return d.y + 5; })
        .attr("text-anchor", "middle")
        .text(function(d){ return d.data["Fruit"]; })
        .style("fill","white")
        .style("font-family", "Helvetica Neue, Helvetica, Arial, san-serif")
        .style("font-size", "12px");
});
</script>
</body>
</html>
Wrapping Long Lables on the Chart
Sometimes, these charts have labels that are too long to fit in the bubbles. There is a solution to wrapping the labels noted by this StackOverflow post.
To the end of your code, add the following JavaScript function:
function wrap(d) {
    var text = d3.select(this),
      width = d.r * 2,
      x = d.x,
      y = d.y,
      words = text.text().split(/\s+/).reverse(),
      word,
      line = [],
      lineNumber = 0,
      lineHeight = 1.1,
      tspan = text.text(null).append("tspan").attr("x", x).attr("y", y);
    while (word = words.pop()) {
      line.push(word);
      tspan.text(line.join(" "));
      if (tspan.node().getComputedTextLength() > width) {
        line.pop();
        tspan.text(line.join(" "));
        line = [word];
        tspan = text.append("tspan").attr("x", x).attr("y", y).attr("dy", ++lineNumber * lineHeight + "em").text(word);
      }
    }
}
Then, to the last line of the block of code where you appended the text lables, add .each(wrap).
You can also limit the size of any bubble that should be labeled by putting a conditional statement in the text function. This example shows how to do both of these things:
bubbles.append("text")
    .attr("x", function(d){ return d.x; })
    .attr("y", function(d){ return d.y + 5; })
    .attr("text-anchor", "middle")
    .text(function(d){

        //Only show text if bubble's radius is more than 25
        if(d.r > 25){

            return d.data["Fruit"];

        } else {

            //bubble has a radius smaller than 25, don't show label
            return "";
        }

    })
    .style("fill","white")
    .style("font-family", "Helvetica Neue, Helvetica, Arial, san-serif")
    .style("font-size", "12px")
    //add this wrap function to wrap long text
    .each(wrap);