Introduction to SVG and Illustrator
Introduction to Scalable Vector Graphics (SVG)
Before we work with charting programs like D3, we need to first understand Scalable Vector Graphics (SVG). An SVG is a type of language which can also be displayed as image in a web browser. It can also be saved as its own file type (.svg) and opened in programs like Adobe Illustrator or InkScape.
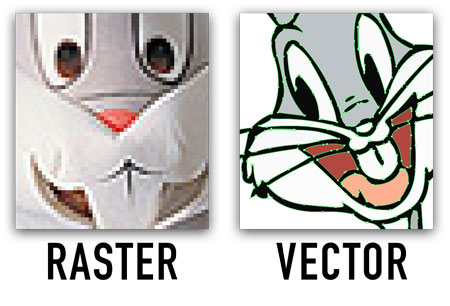
Raster versus Vector
SVGs are vector graphics, which mean they work differently than the jpg images that you see on the web.
- RASTER (jpg, gif) — These are images made up of square pixels. They are usually taken by a camera, and depict real subject matter. If you zoom in too much, these images will get pixelated and lose quality.
- VECTOR (svg) — These are graphics made up of paths and points. They are usually drawn with illustration software. They never lose quality when zooming in.
Creating an SVG inside of HTML
There are many ways to create an SVG. One of the most basic methods is to simply add it directly to your HTML document.
<svg xmlns="http://www.w3.org/2000/svg" width="300px" height="200px">

</svg>
This will create a box to hold a SVG code right on your page. It’s important to set a width and a height, otherwise your graphic may not show up. Between these tags, we will add a number of special SVG tags for creating shapes.
Positioning of elements inside an SVG
Elements inside an SVG are positioned on an X and Y Cartesian coordinate system. The coordinate system might be a little different than other applications, such as those found in basic mathematics, because the 0,0 point is in the upper left-hand corner, and a positive Y axis goes downward.

In this figure, the rectangle has an X coordinate of 2.5 units, and a Y of 2.5 units. If the Y value was a negative, the shape would go above the X axis.
A note about namespaces
SVG is its own markup language, and has unique tags that differ from HTML. Because of this, when you type an <svg> tag, it's important to include a special attribute called a namespace which tells the browser this is a different language other than HTML. The namespace for SVGs vary, but the more common one is xmlns="http://www.w3.org/2000/svg".
Circle Tag
The circle tag adds a circle shape to your SVG.
<svg xmlns="http://www.w3.org/2000/svg" width="300px" height="200px">
    <circle cx="150" cy="100" r="20" fill="red" stroke="black" stroke-width="3px"></circle>
</svg>
The above code would create a red circle, and appear as follows:
The circle tag has the following attributes:
- cx — This is the x value of the center of the circle (center-X)
- cy — This is the y value of the center of the circle (center-Y)
- r — This is the radius of the circle. The radius is half the diameter across.
There are also some attributes which apply to most SVG shapes:
- fill — This is the fill color of the shape, which can also use rbg or hex values.
- stroke — This is the stroke color (stroke is like a border), which can also use rbg or hex values.
- stroke-width — This is width, or thickness, of the stroke. It needs to have a unit of measure, like px.
Rectangle Tag
The rectangle tag adds a rectangle to your SVG.
<svg xmlns="http://www.w3.org/2000/svg" width="300px" height="200px">
    <rect x="50" y="50" width="100" height="50" fill="green"></rect>
</svg>
The above code would create a green rectangle, and appear as follows:
The rectangle tag has the following attributes:
- x — This is the x value of the upper-left edge of the rectangle.
- y — This is the y value of the upper-left edge of the rectangle.
- width — This is width of the rectangle.
- height — This is the height of the rectangle.
Line Tag
The line tag adds a straight line to your SVG.
<svg xmlns="http://www.w3.org/2000/svg" width="300px" height="200px">
    <line x1="25" y1="25" x2="100" y2="100" stroke="blue" stroke-width="4px"></line>
</svg>
The above code would create a blue line, and appear as follows:
The line tag has the following attributes:
- x1 — This is the starting x value of the line.
- y1 — This is the starting y value of the line.
- x2 — This is the ending x value of the line.
- y2 — This is the ending y value of the line.
Polygon Tag
The polygon tag adds a shape with multiple straight sides to your SVG.
<svg xmlns="http://www.w3.org/2000/svg" width="300px" height="200px">
    <polygon points="10,15 50,20 40,100 15,90" fill="yellow" stroke="black"></polygon>
</svg>
The above code would create a yellow polygon, and appear as follows:
The polygon tag has one primary attribute which defines its sides.
- points — The value is a set of space-separated
x,ycoordinates which define each point, like connect-the-dots.
Path Tag
The path tag adds a free form shape, with a combination of either straight or curved sides, to your SVG.
<svg xmlns="http://www.w3.org/2000/svg" width="300px" height="200px">
    <path d="M24.229,37.582c0,0,0.872-15.561,7.377-7.525c0,0,9.144,1.383,3.276,7.123
    c0,0-5.103,2.806-1.276,6.632l3.444,11.48l-12.5,5.484L2.929,
    33.352l2.041-21.025l13.459-6.398c0,0-4.337,10.459-2.679,10.204
    s7.438,2.699,8.332,9.586s-15.857-1.933-10.627,1.128S17.214,
    40.643,24.229,37.582z" stroke="orange" stroke-width="1px"></path>
</svg>
The above code would create a black free form shape, and appear as follows:
The path tag has a single attribute which defines its shape, the d attribute. Inside, is a series of comma-separate coordinate numbers, each preceded by a letter. Each letter stands for a different way the path is drawn:
- M — moveto
- L — lineto
- H — horizontal lineto
- V — vertical lineto
- C — curveto
- S — smooth curveto
- Q — quadratic Bézier curve
- T — smooth quadratic Bézier curve to
- A — elliptical Arc
- Z — closepath
An example of a square would look like:
<path d="M25,25 L25,50 L50,50 L50,25 Z" />
In the above example, the coordates refer to
- M (move to) x 25, y 25
- L (line to) x 25, y 50
- L (line to) x 50, y 50
- L (line to) x 50, y 25
- Z (close the path)
Curves in paths can be tricky and requires a basic understanding of Bezier curves. MDN has a good tutorial if you’re interested.
Text Tag
The text tag adds text to your SVG. The text is slightly different than HTML text, because it’s vector-based and can be manipulated as such.
<svg xmlns="http://www.w3.org/2000/svg" width="300px" height="200px">
    <text x="25" y="50" font-size="36px" fill="brown">hello world!</text>
</svg>
The above code would create a brown text, and appear as follows:
The text tag has the following attributes:
- x — This is the x value of the upper-left hand corner of the text box.
- y — This is the y value of the upper-left hand corner of the text box.
- font-family — This is the font stack (i.e. Helvetica, Arial, sans-serif) of the text.
- font-size — This is the size of the text.
TSpan Tag
SVG Text cannot wrap to a new line like HTML. Instead, you need to specify the exact position of each line of text using the tspan tag. The tspan tag is designed to go inside the text tag.
<svg xmlns="http://www.w3.org/2000/svg" width="300px" height="200px">
    <text x="0" y="0" font-size="36px">
        <tspan x="0" dy="30" fill="green">hello</tspan>
        <tspan dx="-50" dy="40" fill="red">world!</tspan>
    </text>
</svg>
The above code would create a blue line, and appear as follows:
The tspan tags can use either an x y attributes, which are absolute and take precedence from its parent text tag, or it can use the dx dy, which is a relative measurement:
- x — Absolute x value of this line of text (overrides the x value from the parent text tag.)
- y — Absolute y value of this line of text (overrides the y value from the parent text tag.)
- dx — Relative to the tag before it. If it’s the second tspan, it’s relative to the end of the first line of text
- dy — Relative to the tag before it. If it’s the second tspan, it’s relative to the end of the first line of text
Notice we put a negative dx in the second line of text. This is because the starting point is at the end of the first line of text.
Grouping Tag
The grouping tag is a way to group multiple shapes together so that they can be positioned in a specific location in your SVG. The group tag alone doesn’t actually display anything, it’s designed to wrap around other shapes. The group tag is denoted by a <g>.
<svg xmlns="http://www.w3.org/2000/svg" width="300px" height="200px">
    <g transform="translate(125, 50)">
        <circle cx="0" cy="0" r="10" fill="red"></circle>
        <text x="0" y="25" text-anchor="middle">A red circle</text>
    </g>
</svg>
The above code would create a red circle with text below it, and appear as follows:
- transform — An attribute used to apply a number of transformation effects. The most basic is translate which can move the grouping to a different starting X and Y point. You also have rotate to rotate an element, and scale to make an element larger or smaller. You can combine multiple translate values together like so:
<g transform="translate(2,10)rotate(-90)scale(1.1)">
</g>