How to make a waffle chart in D3
Basic Waffle Chart
Step 1: Prepare your data as a CSV file
In this example, we will be using traffic collision data from Alameda County. To make follow this tutorial, download this data here:
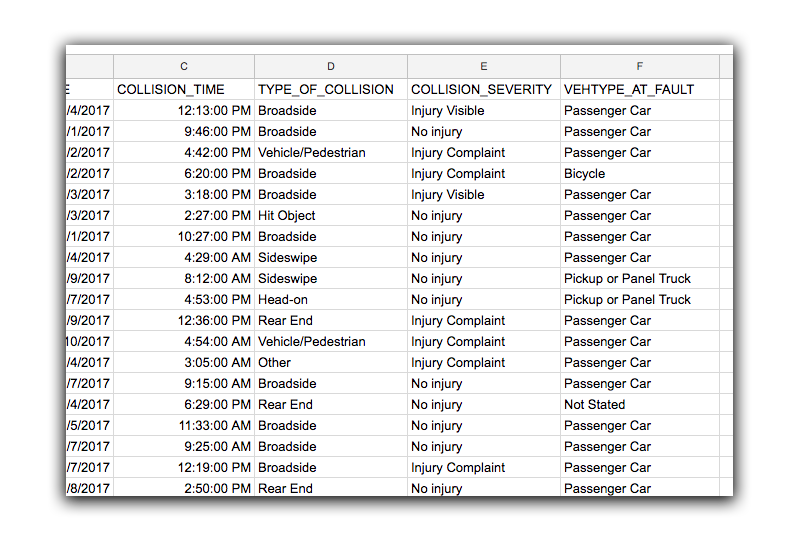
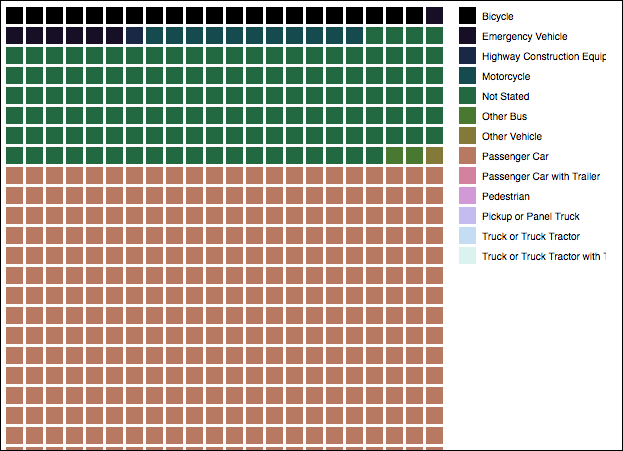
Note: That in the dataset given above, there are numerous columns we could display. Waffle charts must be show categorial data, so that the color coding represents percentages of a whole. In this lesson, we will choose to use the VEHTYPE_AT_FAULT column for our color coding.
Step 2: Setup our document
As usual, we will setup our chart as we normally do, setting up the width and height attributes and assigning them to variables. (At this point we will assume you’ve setup your HTML document and included the D3 library).
var margin = {top:10,right:150,bottom:30,left:0},
    width  = 600 - margin.left - margin.right,
    height = 700 - margin.top - margin.bottom,
    boxSize = 20, //size of each box
    boxGap = 3, //space between each box
    howManyAcross = Math.floor(width / boxSize);

var svg = d3.select("body")
    .append("svg")
    .attr("width", width + margin.left + margin.right)
    .attr("height", height + margin.top + margin.bottom)
    .attr("viewBox", "0 0 " + (width + margin.left + margin.right) + " " + (height + margin.top + margin.bottom));
Step 3: Setup our scales, and specifying our header
I’ve created a variable called categoryHeading that will determine which column heading will be used to show the different values as colors on the graphic.
We then setup a g variable, which will store our chart as a group. This is to differentiate it with the legend that will appear next to our chart.
Third, we will setup a color scale, and store that in the colors variable. We will use one of d3’s built in color scales, although, you can switch to any of the other scales if you wish. I’ve modified later code so we can include both continuious as well as categorical scales.
var categoryHeading = "VEHTYPE_AT_FAULT"

var g = svg.append("g")
    .attr("transform","translate(" + margin.left + "," + margin.top + ")");

//rainbow colors
var colors = d3.scaleSequential(d3.interpolateCubehelixDefault);
Step 4: Importing the data, and displaying the chart
At this point, we load in the data, and build out the chart. There is a bit of code that converts a d3 continuious scale to a categorical one. (We basically setup two scales, one that is continious using the column headers (keys) for the domain data. Then we createa categoryScale from that.
d3.csv('traffic-collision-data.csv').then(function(data, i){

     //sort data alphabetically
     data.sort(function(a,b){ return d3.ascending(a[categoryHeading], b[categoryHeading])});

     //get all of the unique values in the column for the scale
     var keys = d3.map(data, function(d){ return d[categoryHeading];}).keys();

     //set domain on category
     colors.domain([0, keys.length]);

     //convert to a categorical scale
     var categoryScale = d3.scaleOrdinal(keys.map(function(d, i){ return colors(i);}));
     categoryScale.domain(keys);//set the scale domain


     //make the main chart
     g.selectAll(".square")
         .data(data)
         .enter()
         .append("rect")
         .attr("class", "square")
         .attr("x", function(d,i){ return boxSize * (i % howManyAcross); })
         .attr("y", function(d,i){ return Math.floor(i/howManyAcross) * boxSize; })
         .attr("width", boxSize - 3)
         .attr("height", boxSize - 3)
         .attr("fill", function(d){ return categoryScale(d[categoryHeading]);})
         .exit();


     //legend
     var legend = svg.selectAll(".legend")
         .data(keys)
         .enter();


     legend.append("rect")
         .attr("x", margin.left + width + boxGap )
         .attr("y", function(d,i){ return (i * boxSize) + margin.top; })
         .attr("width", boxSize - 3)
         .attr("height", boxSize - 3)
         .attr("fill", function(d){ return categoryScale(d); })

     legend.append("text")
         .attr("x", margin.left + width + boxSize + (boxGap*2))
         .attr("y", function(d,i){ return (i * boxSize) + margin.top; })
         .append("tspan")
         .attr("dx", 0)
         .attr("dy", boxSize/2)
         .style("alignment-baseline", "middle")
         .style("font-size", 10)
         .style("font-family", "Helvetica, Arial, sans-serif")
         .text(function(d){ return d;})
 });