How to make a Line Chart in D3
Basic Line Chart

Prepare your data as a CSV file
Make sure your data are real numbers, and have no commas or symbols in them (decimals are OK).
Save your spreadsheet as a .csv file in a folder where you will put the html for your bar chart.
Difference from Bar Chart
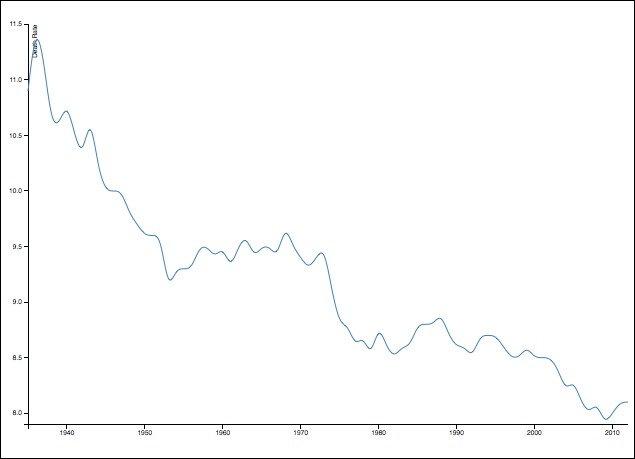
The biggest difference in creating a line chart is using the line function in D3.
var line = d3.line()
    .x(function(d) { return x(d.date); })
    .y(function(d) { return y(d.death); })
    .curve(d3.curveMonotoneX); //optional, for smoother lines
    //For examples of different curve styles, see:
    // https://bl.ocks.org/d3noob/ced1b9b18bd8192d2c898884033b5529
This function takes the x and y scale datea x() and y() and it will automatically compute a line. In your chart, you will call this line function as the value of the d attribute of the <path> element.
svg.append("path")
    .datum(data)
    .attr("class", "line")
    .attr("d", line); //we apply the line variable, which we determined earlier
The result will be a path element that is drawn appropriately.
Optionally adding a focus line
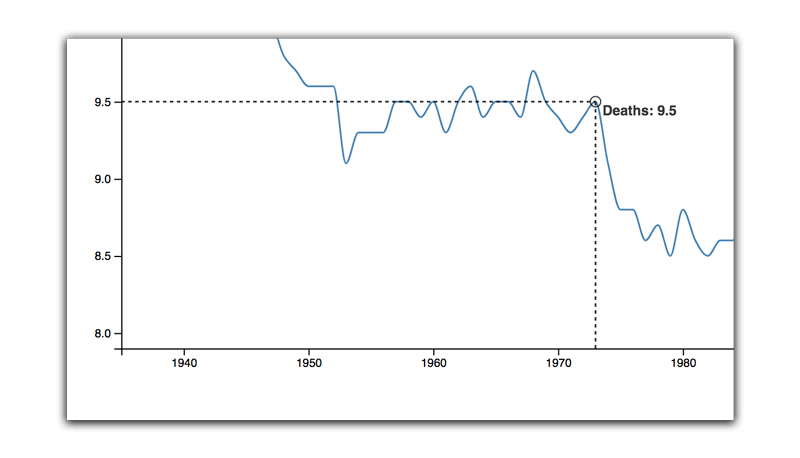
Line charts can give you the gist of the data, but many times you want the user to be able to read data on exact points on the line. We can add a focus line that will snap to specific values of data.

First, let’s create the svg components: two lines, a circle, and a piece of text.
var focus = chart.append("g")
    .attr("class", "focus")
    .style("opacity", 0.8);

//text tooltip that will describe data
focus.append("text")
  .attr("class", "line1")
  .attr("x", 6)
  .attr("dy", "1em")
  .attr("font-size", 12)
  .attr("font-weight","bold")
  .attr("font-family", "sans-serif");

//circle over the line showing specific point
focus.append("circle")
  .attr("id", "circle-highlight")
  .attr("r",4.5)
  .style("fill","none")
  .style("stroke", "black");

//x (horizontal) line to see where data lies on y axis
focus.append("line")
  .classed("x", true)
  .style("fill","none")
  .style("stroke", "black")
  .style("stroke-width", "1.5px")
  .style("stroke-dasharray", "3 3");

//y (vertical) line to see where data lies on x axis
focus.append("line")
  .classed("y", true)
  .style("fill","none")
  .style("stroke", "black")
  .style("stroke-width", "1.5px")
  .style("stroke-dasharray", "3 3");
Next, we create a large invisible rectangle that covers our chart. This rectangle will capture mouse events, so we know the user hovers over the chart. This method also allows us to turn off the focus line when the use moves their mouse cursor off the chart.
We’ll add some .on('mouseover', function(){}) events to describe what should happen when the user moves their mouse over or off this invisible rectangle.
NOTE: If you are adapting this code to your own chart, make sure to change “death” and “date” properties to match the columns in your own data.
//create invisible rectangle with no fill
chart.append("rect")
    .attr("class", "overlay")
    .attr("width", width)
    .attr("height", height)
    .style("fill","none")
    .style("pointer-events", "all")

    //show focus lines when mousing over
    .on("mouseover", function(){ focus.style("display", null); })

    //hide focus lines when mousing off
    .on("mouseout", function(){ focus.style("display", "none"); })

    //when moving the mouse, adjust focus lines
    .on("mousemove", function (){

      //get the mouse x position
      var mouseX = d3.mouse(this)[0];

      //use x scale to calculate where mouse relative to chart
      var xData = x.invert(mouseX);

      //calculate where the x value is relative to each point in the data.
      //if exactly between two points, use the "left" most point.
      //To understand bisector, see https://stackoverflow.com/a/26883562
      var bisectX = d3.bisector(function(d){return d.date;}).left;

      //find out which data point we're closest to along the X axis
      var ix = bisectX(data, xData);

      //set x and y coordinates of the lines
      focus.select("line.x")
        .attr("x1", 0)
        .attr("y1", y(data[ix].death))
        .attr("x2", x(data[ix].date))
        .attr("y2", y(data[ix].death));

      focus.select("line.y")
        .attr("x1", x(data[ix].date))
        .attr("y1", height)
        .attr("x2", x(data[ix].date))
        .attr("y2", y(data[ix].death));

      focus.select("circle")
        .attr("cx", x(data[ix].date))
        .attr("cy", y(data[ix].death));

      focus.select("text")
        .attr("transform", "translate(" + x(data[ix].date) + "," + y(data[ix].death) + ")")
        .text("Deaths: " + data[ix].death);

    });
Example of a line chart with focus lines
NOTE: This file requires deathrates.csv to be in the same folder as your .html file. You also need to run this from a webserver for it to work.
<!DOCTYPE html>
<html>
<head>
    <meta charset="utf-8">
    <title>Line Chart Example</title>
</head>
<body>

<script src="https://d3js.org/d3.v5.min.js"></script>
<script type="text/javascript">

var margin = {top:50, right:0, bottom:70, left:70},
    width  = 900 - margin.left - margin.right,
    height = 600 - margin.top - margin.bottom;

// parse the date / time
var parseDate = d3.timeParse("%Y")


//Note: If your x scale is not time data, then you"ll want to use
// d3.scalePoint() instead for your x variable below

//set the scales based on time
var x = d3.scaleTime().range([0, width]);
var y = d3.scaleLinear().range([height, 0]);


var line = d3.line()
    .x(function(d) { return x(d.date); })
    .y(function(d) { return y(d.death); })
    .curve(d3.curveMonotoneX);
    //For examples of different curve styles, see:
    // https://bl.ocks.org/d3noob/ced1b9b18bd8192d2c898884033b5529

var svg = d3.select("body")
    .append("svg")
    .attr("width", width + margin.left + margin.right)
    .attr("height", height + margin.top + margin.bottom);

var chart = svg.append("g")
    .attr("transform", "translate(" + margin.left + "," + margin.top + ")");

d3.csv("deathrates.csv").then(function(data) {

    data.forEach(function(d) {
        d.date = parseDate(d.Year); //parseDate(d.Year);
        d.death = +d["Crude death rate (per 1,000)"];
    });

    x.domain(d3.extent(data, function(d) { return d.date; }));
    y.domain(d3.extent(data, function(d) { return d.death; }));

    svg.append("g")
        .attr("class", "x axis")
        .attr("transform", "translate(" + margin.left + "," + (height + margin.top) + ")")
        .call(d3.axisBottom(x));

    svg.append("g")
        .attr("transform", "translate(" + margin.left + "," + margin.top + ")")
        .call(d3.axisLeft(y))
        .append("text")
        .attr("transform", "rotate(-90)")
        .attr("y", 6)
        .attr("dy", ".71em")
        .style("text-anchor", "end")
        .style("fill", "black")
        .text("Death Rate (Per 1,000)");

    chart.append("path")
        .datum(data)
        .attr("class", "line")
        .attr("d", line)
        .style("stroke","steelblue")
        .style("stroke-width","1.5px")
        .style("fill","none");


  //OPTIONAL: focus line
  var focus = chart.append("g")
      .attr("class", "focus")
      .style("opacity", 0.8);

    focus.append("text")
      .attr("class", "line1")
      .attr("x", 6)
      .attr("dy", "1em")
      .attr("font-size", 12)
      .attr("font-weight","bold")
      .attr("font-family", "sans-serif");

    focus.append("circle")
      .attr("id", "circle-highlight")
      .attr("r",4.5)
      .style("fill","none")
      .style("stroke", "black");

    focus.append("line")
      .classed("x", true)
      .style("fill","none")
      .style("stroke", "black")
      .style("stroke-width", "1.5px")
      .style("stroke-dasharray", "3 3");

    focus.append("line")
      .classed("y", true)
      .style("fill","none")
      .style("stroke", "black")
      .style("stroke-width", "1.5px")
      .style("stroke-dasharray", "3 3");

    //append a rectangle over the entire chart
    //that reacts to when the mouse hovers over
    chart.append("rect")
        .attr("class", "overlay")
        .attr("width", width)
        .attr("height", height)
        .style("fill","none")
        .style("pointer-events", "all")
        .on("mouseover", function(){ focus.style("display", null); })
        .on("mouseout", function(){ focus.style("display", "none"); })
        .on("mousemove", function (){

          //get the mouse x position
          var mouseX = d3.mouse(this)[0];

          //use x scale to calculate position
          var xData = x.invert(mouseX);

          //calculate the x value based on each point in the data.
          var bisectX = d3.bisector(function(d){return d.date;}).left;

          //find out which data point we're closest to along the X axis
          var ix = bisectX(data, xData);

          focus.select("line.x")
            .attr("x1", 0)
            .attr("y1", y(data[ix].death))
            .attr("x2", x(data[ix].date))
            .attr("y2", y(data[ix].death));

          focus.select("line.y")
            .attr("x1", x(data[ix].date))
            .attr("y1", height)
            .attr("x2", x(data[ix].date))
            .attr("y2", y(data[ix].death));

          focus.select("circle")
            .attr("cx", x(data[ix].date))
            .attr("cy", y(data[ix].death));

          focus.select("text")
            .attr("transform", "translate(" + x(data[ix].date) + "," + y(data[ix].death) + ")")
            .text("Deaths: " + data[ix].death);
    });

});
</script>
</body>
</html>