How to make a Line Chart in D3
Basic Line Chart
Prepare your data as a CSV file
Make sure your data are real numbers, and have no commas or symbols in them (decimals are OK).
Save your spreadsheet as a .csv file in a folder where you will put the html for your bar chart.
Difference from Bar Chart
The biggest difference in creating a line chart is using the line function in D3.
var line = d3.line()
    .x(function(d) { return x(d.date); })
    .y(function(d) { return y(d.death); })
    .interpolate("basis"); //optional, for smoother lines
This function takes the x and y scale datea x() and y() and it will automatically compute a line. In your chart, you will call this line function as the value of the d attribute of the <path> element.
svg.append("path")
    .datum(data)
    .attr("class", "line")
    .attr("d", line); //we apply the line variable, which we determined earlier
The result will be a path element that is drawn appropriately.
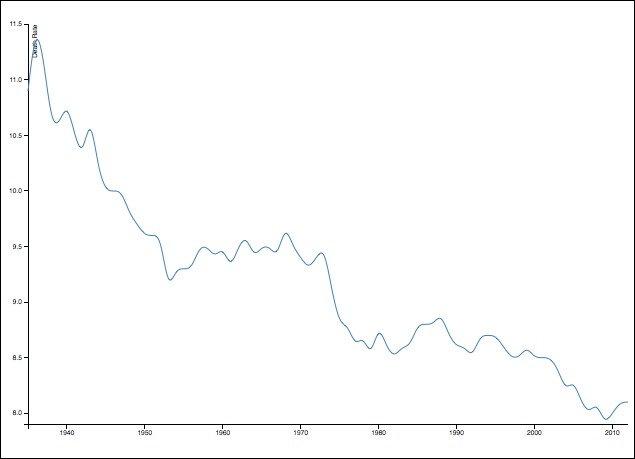
Example of a line chart
<!DOCTYPE html>
<html>
<head>
    <meta charset="utf-8">
    <title></title>
</head>
<body>

    <script src="https://d3js.org/d3.v4.min.js"></script>
    <script type="text/javascript">

    var margin = {top:50, right:0, bottom:70, left:70},
        width  = 900 - margin.left - margin.right,
        height = 600 - margin.top - margin.bottom;

    // parse the date / time
    var parseDate = d3.timeParse("%Y");


    //Note: If your x scale is not time data, then you'll want to use
    // d3.scalePoint() instead for your x variable below

    //set the scales based on time
    var x = d3.scaleTime().range([0, width]);
    var y = d3.scaleLinear().range([height, 0]);


    var line = d3.line()
        .x(function(d) { return x(d.date); })
        .y(function(d) { return y(d.death); })
        .curve(d3.curveMonotoneX);
        //For examples of different curve styles, see:
        // https://bl.ocks.org/d3noob/ced1b9b18bd8192d2c898884033b5529

    var svg = d3.select("body")
        .append("svg")
        .attr("width", width + margin.left + margin.right)
        .attr("height", height + margin.top + margin.bottom);

    var chart = svg.append("g")
        .attr("transform", "translate(" + margin.left + "," + margin.top + ")");

    d3.csv("deathrates.csv", function(error, data) {
        if (error) throw error;

        data.forEach(function(d) {
            d.date = parseDate(d.Year); //parseDate(d.Year);
            d.death = +d["Crude death rate (per 1,000)"];
        });

        x.domain(d3.extent(data, function(d) { return d.date; }));
        y.domain(d3.extent(data, function(d) { return d.death; }));

        svg.append("g")
            .attr("class", "x axis")
            .attr("transform", "translate(" + margin.left + "," + (height + margin.top) + ")")
            .call(d3.axisBottom(x));

        svg.append("g")
            .attr("transform", "translate(" + margin.left + "," + margin.top + ")")
            .call(d3.axisLeft(y))
            .append("text")
            .attr("transform", "rotate(-90)")
            .attr("y", 6)
            .attr("dy", ".71em")
            .style("text-anchor", "end")
            .text("Death Rate");

        chart.append("path")
            .datum(data)
            .attr("class", "line")
            .attr("d", line)
            .style("stroke","steelblue")
            .style("stroke-width","1.5px")
            .style("fill","none");
    });
    </script>
</body>
</html>